NFS – Block Size Monitor (DTrace powered)
Hello there! Yesterday i was coding a simple tool to provide a better visualization of the block’s sizes (read/write) on a NFS server. The primary objective was not consolidate informations, but just quickly visualize trends, for a short period of time. Well, with the NFSv3 provider, you can find a nice script on the NFS wiki page. With a few modifications, i did use it to make my implementation easier. You know, is not the better to do on the weekend, so i did not want to waste much time with this tool. Hmmm, was a fight! ;-)
And today, while my family was seeing a movie, i was fighting a little more…
Because i have used many “procedures/functions” from my other projects, my dtrace script’s output is compatible with the format of the configuration files i do use in that projects. So, read from the stdin was easy and i did make just a few changes in my code.
You can see the DTrace script i have used on the following code:
#!/usr/sbin/dtrace -s
#pragma D option quiet
#pragma D option switchrate=10hz
nfsv3:::op-read-start
{
printf(“%s=%6d\n”, “r”, args[2]->count);
}
nfsv3:::op-write-start
{
printf(“%s=%6d\n”, “w”, args[2]->count);
}
The output from the above script is something like this:
r= 2345
w= 512
r= 512
r= 512
r= 32768
As you can see, mimics a configuration file, and we were getting somewhere (parse, and hold the numbers). End of round 1. ;-)
For the visualization, i have used ncurses for three basic reasons:
1) It’s easy! If i could write, anyone can do it…
2) It’s powerfull! You can make complex things with it.
3) It’s designed for the terminal, and that is what i did want. The main function is clean and short.
End of the round two.
Well, for the most important part there is no escape… we need to think, and do math. Well, because i did want it ready for use tomorrow, i did (for sure) many things that will make a real C hacker scream! ;-) But there is always a good side: as any software i do write, it’s Open Source (GPL).
So please: fix it! ;-)
To test, i did use the following script:
perl -e “$| = 1; while (true) { \\
printf (\”r= %d\\n\”, int(rand(300000))); \\
printf (\”w= %d\\n\”, int(rand(300000)));}”
You can use the script above, and pipe it to the NFS block Size Monitor. Another good test is use “tee” (between the two), to redirect the output to a file, and make some comparisons between the results.
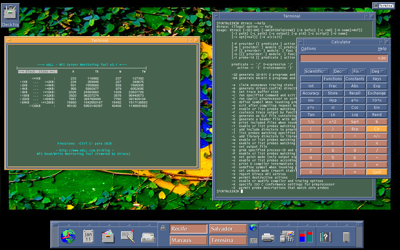
Here you can see it in action on my desk:
Features:
Legend:
R – Count how many reads in that range;
W – Count how many writes in that range;
TR – The amount of data that was read using the blocks on that range;
TW – The amount of data that was write using the blocks on that range;
Todo:
– I did use integer (just 10 digits)…
– Add to the input the OFFSET of the file (write), and that information can indicate file creation ratio
It’s not 100% true, but if you know the workload (is not database, or binary updates), can be useful;
– Create an IPS package;
– When one counter go beyond 50% the sum of all counters, change its color to red;
Each call to print the counters already have a property to change color. ;)
– Make it more elegant…
IMPORTANT:
…and as always, comments are welcome!
Are you ready? If so, just make it!
peace.


Do you have some reason for the don’t use in production warnings? Dtrace was designed to be safe in production, and since this doesn’t do anything special the warnings seem unjustified.
Well, Dtrace was designed to be safe in production… ;-)
The NFS block monitor is in v0.1, and we need to test it to see if there is no risk for the system (a memory leak for example).
Use at your own risk! ;-)
Thats smockin’ hot. Very nice job!!!